
What Does School Choice Look Like for the City’s Kids?
For New York City public school students, choosing a high school can be as daunting as choosing a college. Kids who don’t want to attend their neighborhood — or zoned — high school can choose from more than 400 schools, each with its own admissions criteria and different acceptance odds. Students as young as 10 or 11 can begin, with lots of adult help, to research the maze of tests, application essays, interviews and auditions. Columbia Journalism School students in the Covering Education seminar interviewed dozens of middle school children across the five boroughs, from the 15-year old son of a Mexican immigrant in the Bronx who missed the deadline by a day, to the child of Manhattan professionals with a private tutor who was accepted to every top school, the range of experiences begs the question: who does this system of choice serve? Does it create equity, or inequity? We would like to hear your stories about navigating the maze of high school admissions. Please leave a comment or send an email with your experiences. Read on below to hear more:
The Students
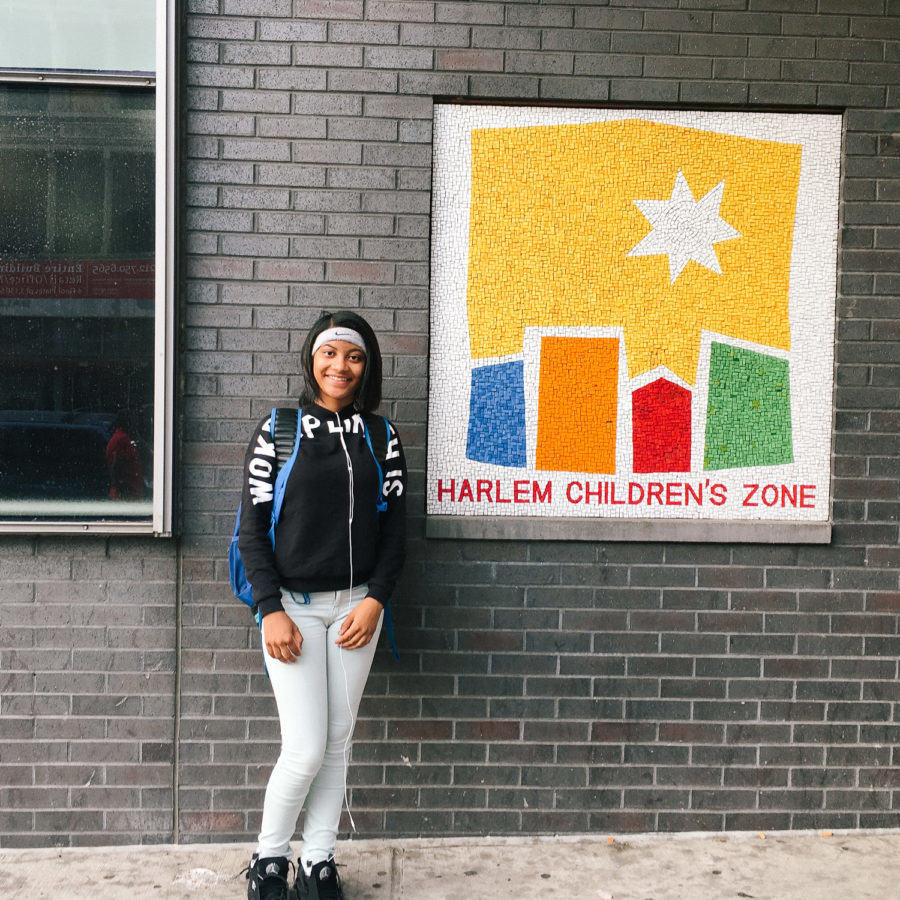
Click on a photo to learn more about the student.

Ali Ruiz
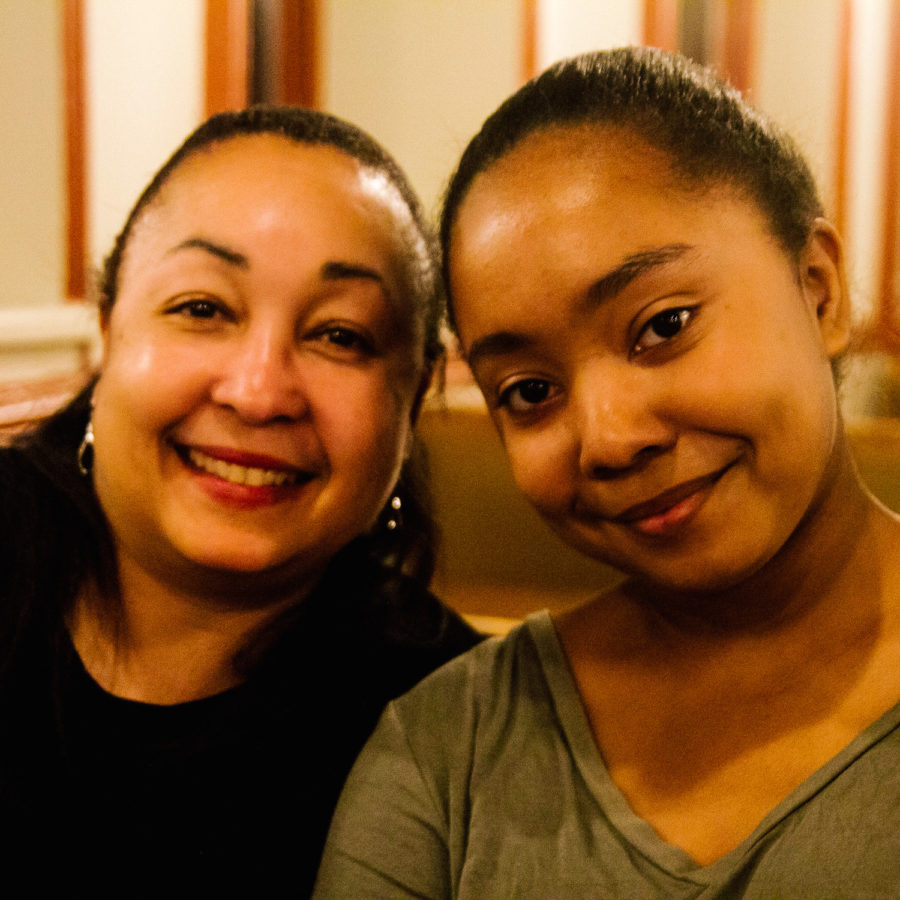
Carla Hamilton
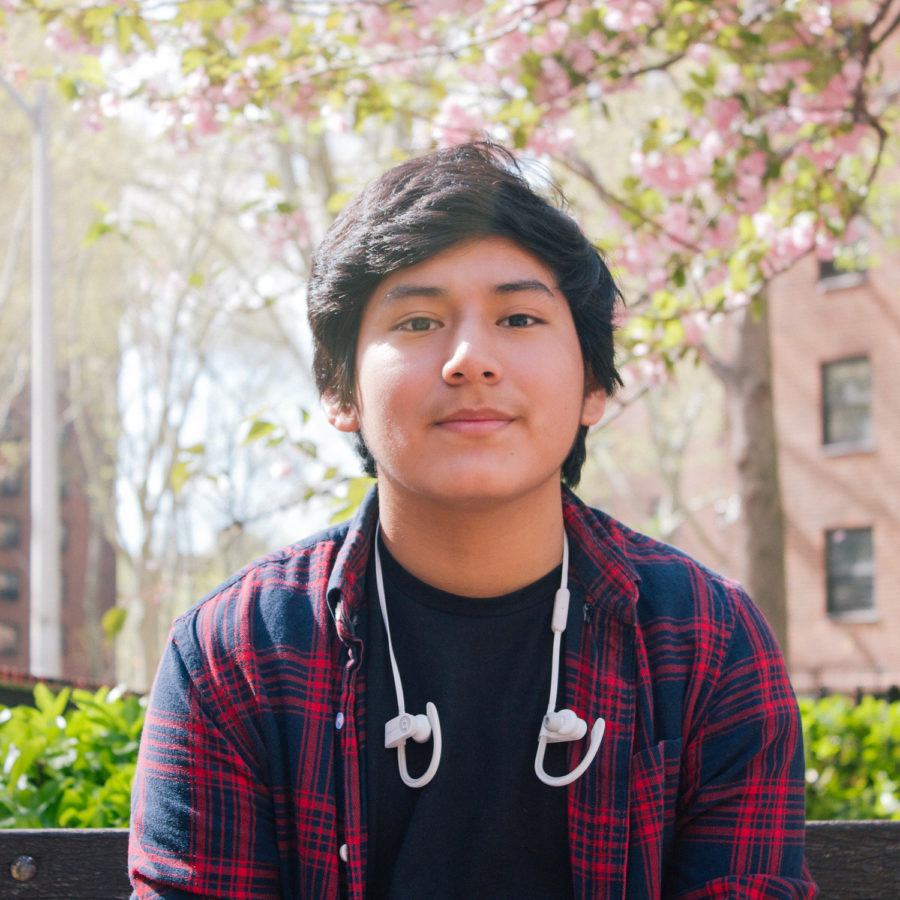
Christian Guaman

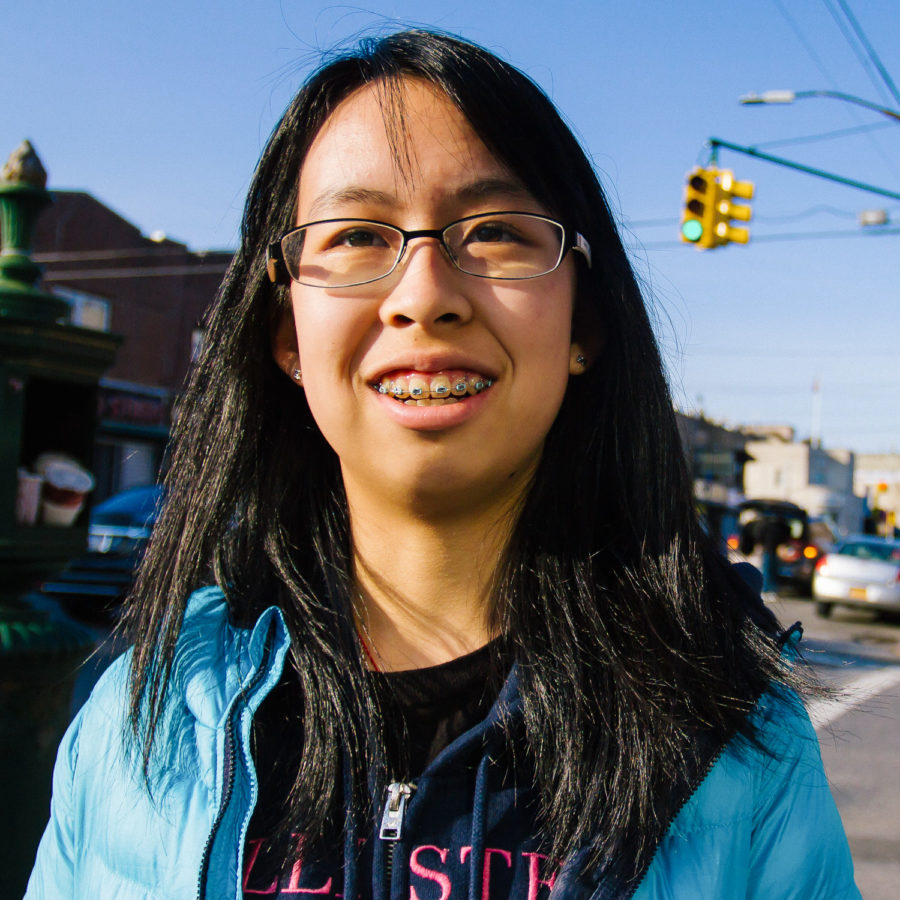
Emily Zhang

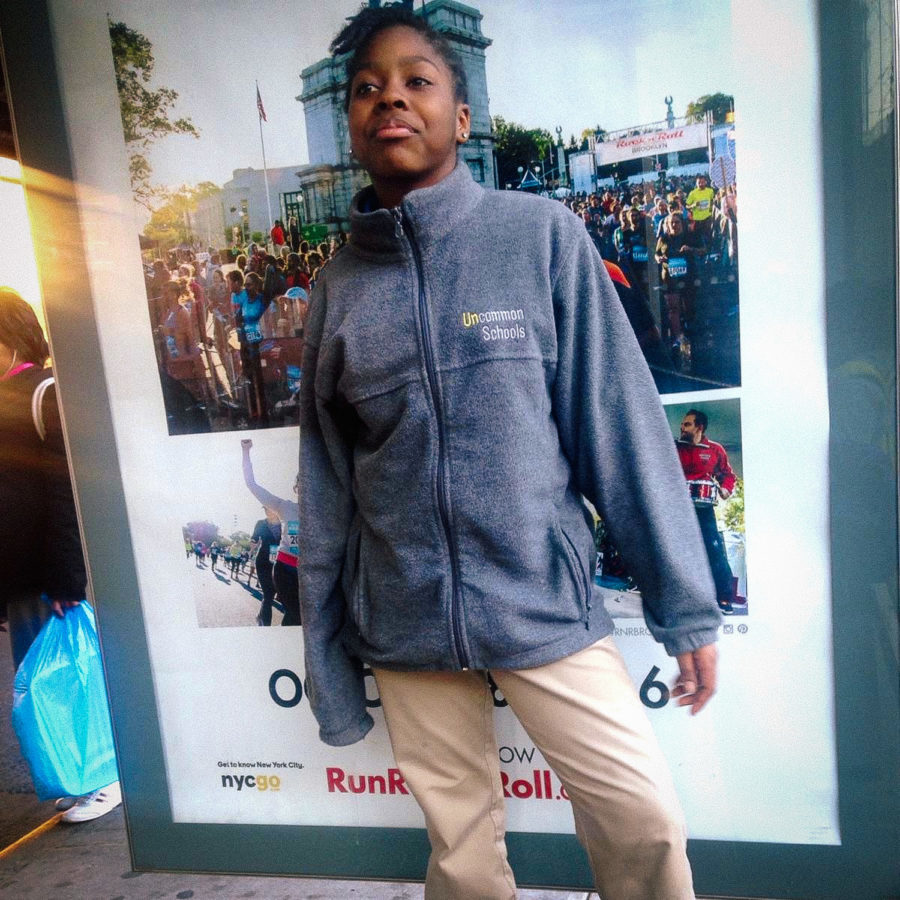
Ezelle Trapp-Sherman
Johnathan Lugo

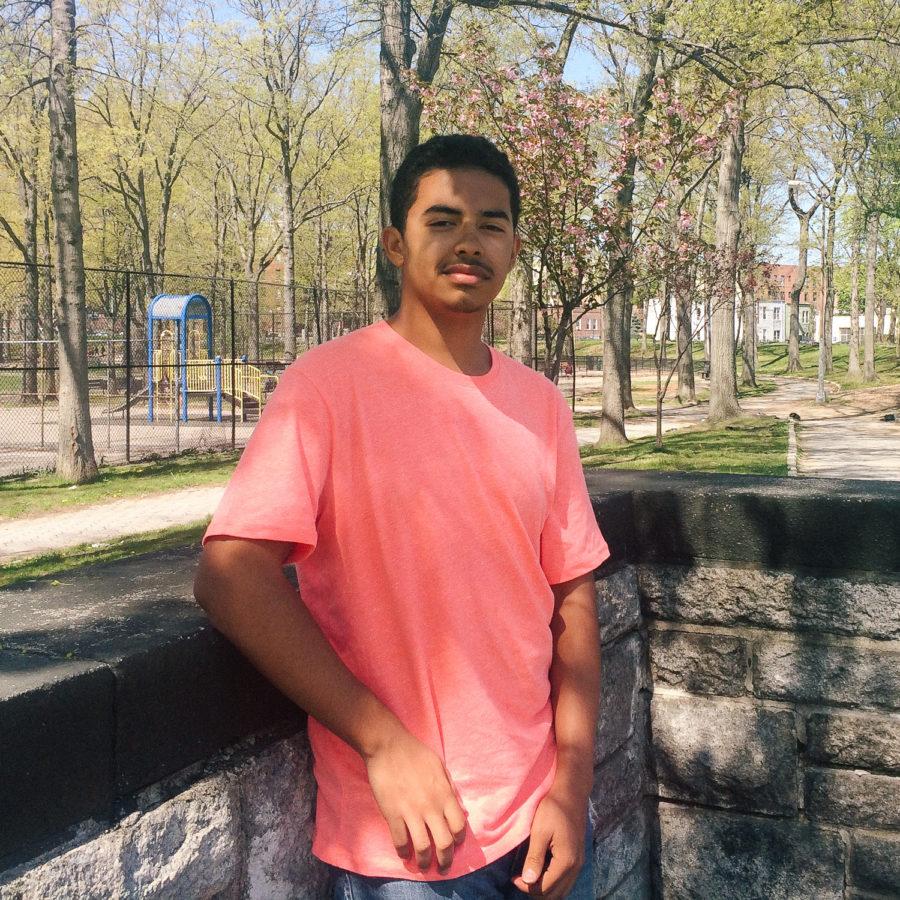
Josue Soriano

Latisha McCoy
Peihua Huang

Sen Oglesby

Ali Ruiz

Shania Prescod
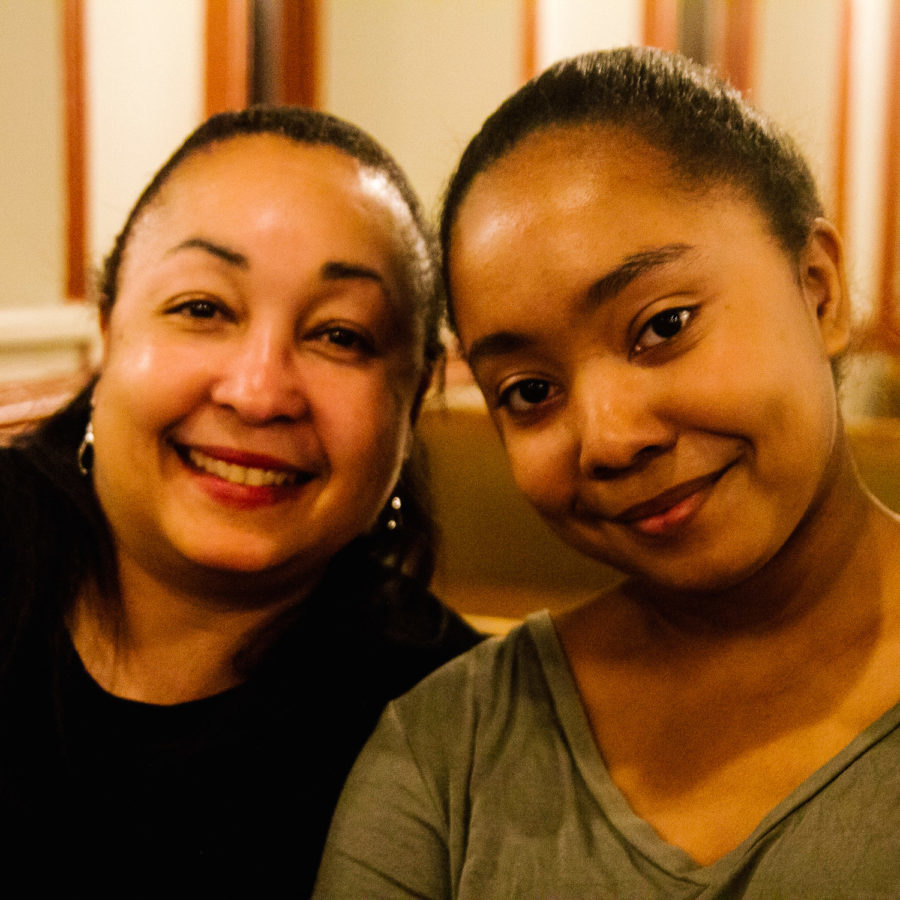
Carla Hamilton

Christian Guaman
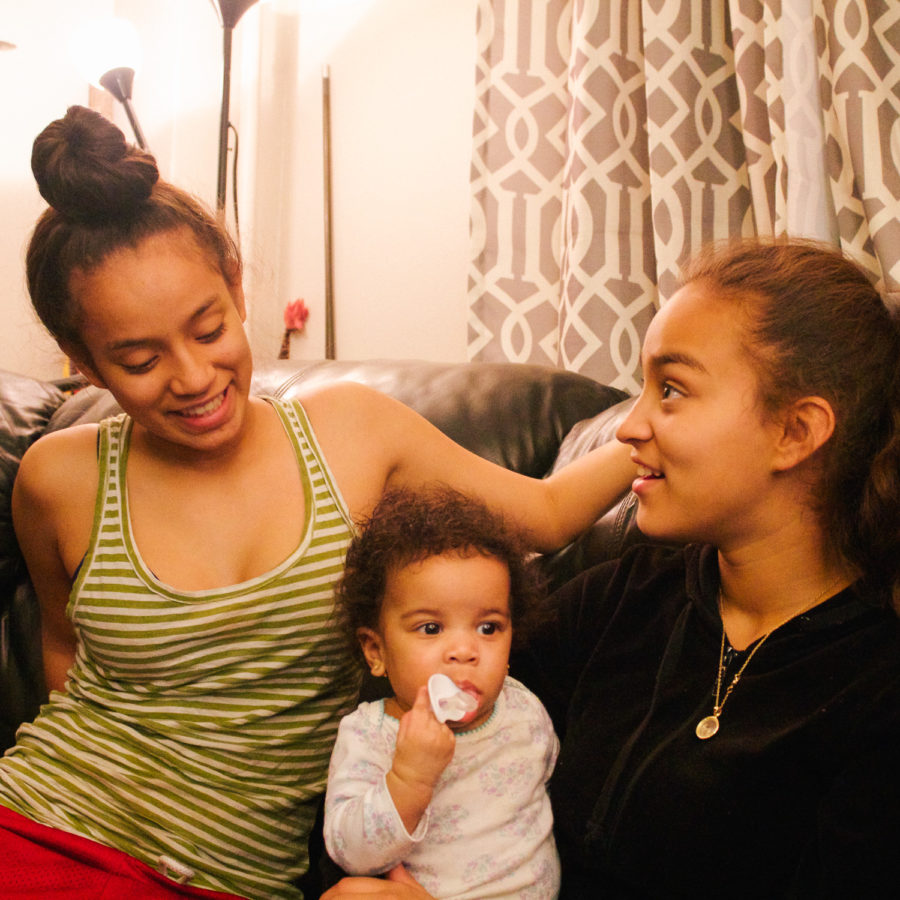
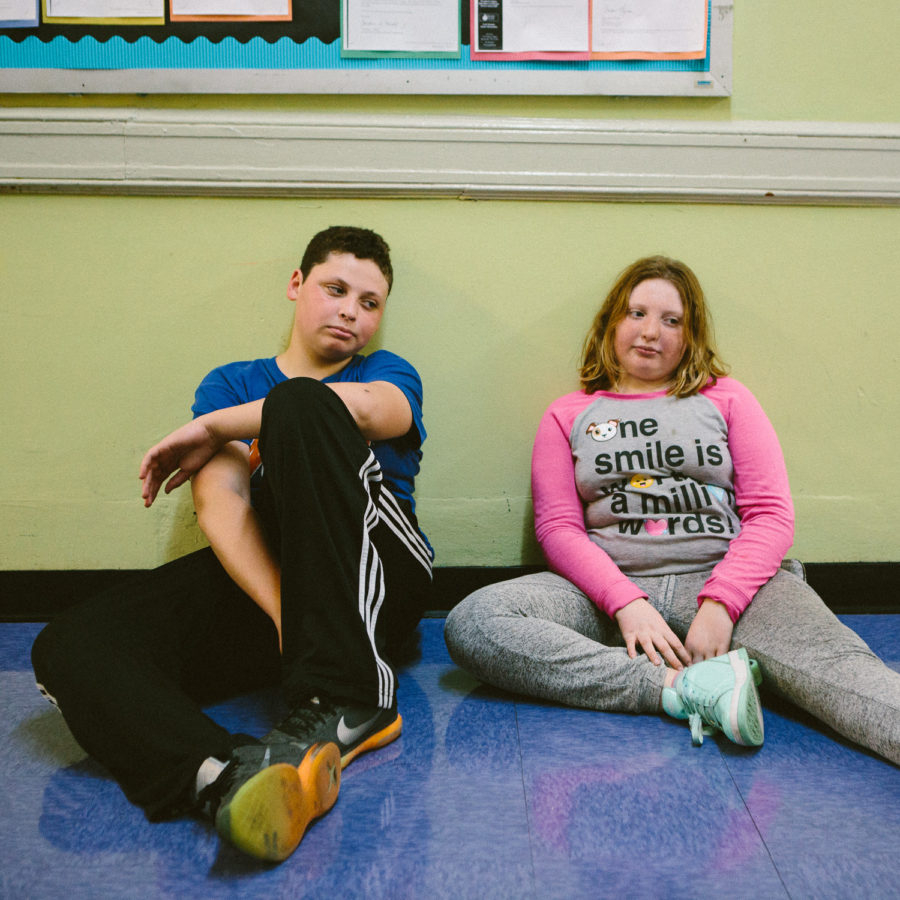
Jamie and Jovannitza Torres

Emily Zhang
Ezelle Trapp-Sherman

Victoria Rodriguez

Johnathan Lugo
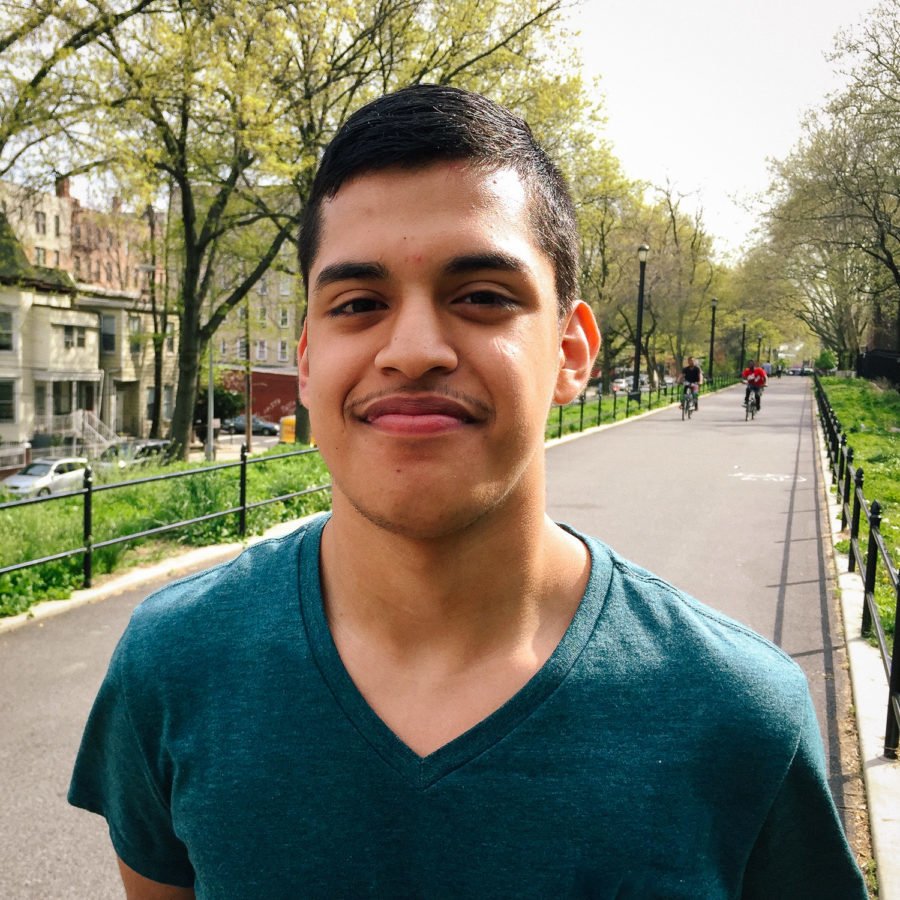
Josue Soriano
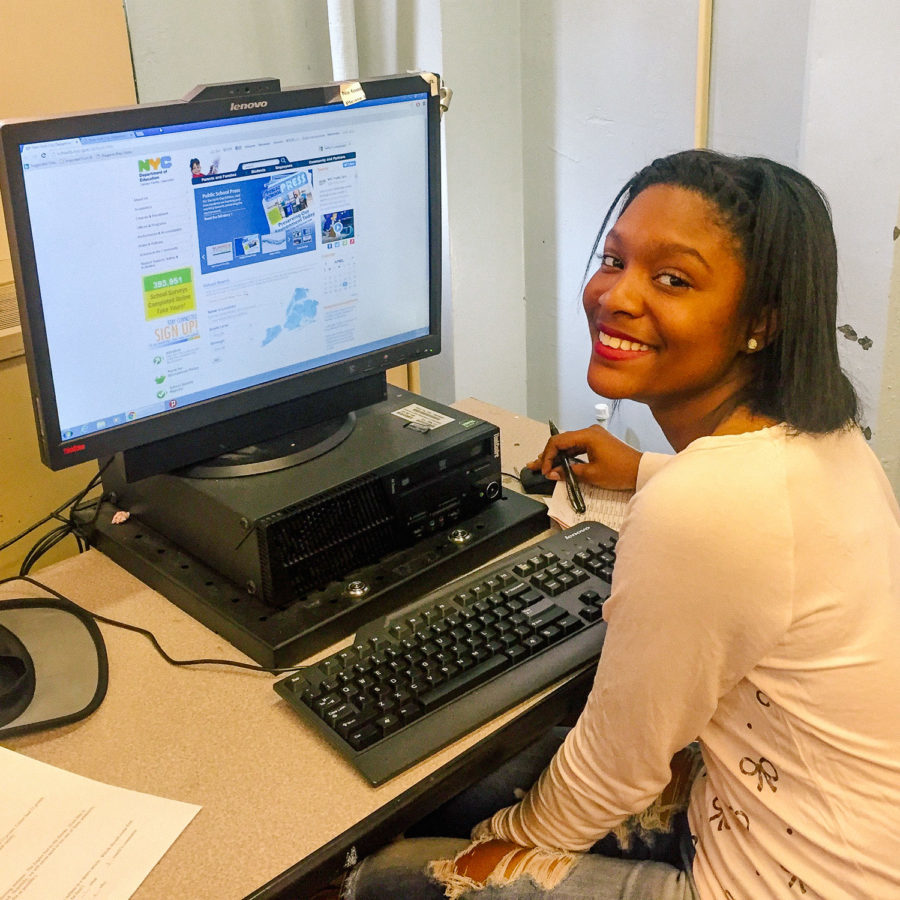
Latisha McCoy
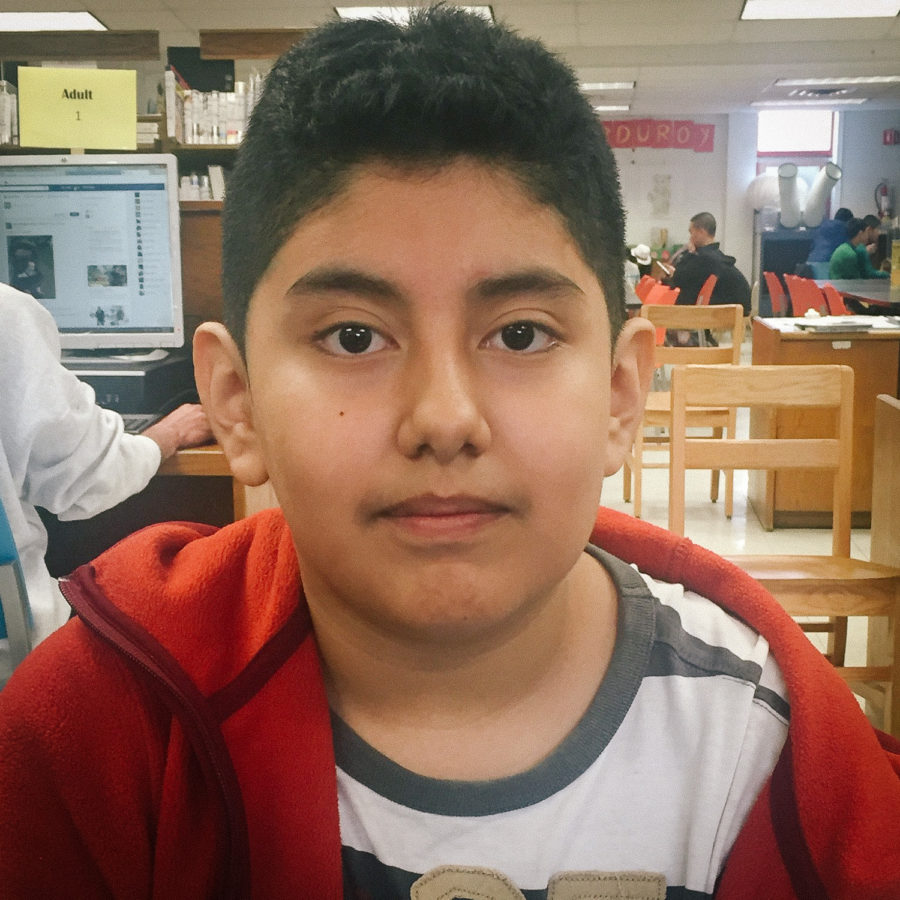
David Mizhquiri

Peihua Huang

Sen Oglesby
Ethan Moskowitz
Shania Prescod

Jamie and Jovannitza Torres
Victoria Rodriguez

David Mizhquiri

Ethan Moskowitz
The System
The current school choice system was introduced roughly 15 years ago in an attempt to level the academic playing field, allowing students from any borough to apply to the city’s best schools. From specialized high schools that base admissions solely on a competitive state-mandated entrance exam to other strong schools that choose students based on their middle school grades, attendance records, and test scores, advocates hoped that all this choice would rebuild the meritocracy and eliminate the “zip code lottery” of the past.
Students are matched to schools using a complex deferred acceptance algorithm (the same used to match medical school students to medical residency programs), designed by a Nobel-Prize-winning economist. Students rank up to 12 schools in the fall of their eighth grade year and are offered a school in the spring. Those who do not receive a placement have a number of options, including attending their zoned (neighborhood) school or vying for a spot in schools that still have openings in the round two admissions cycle.
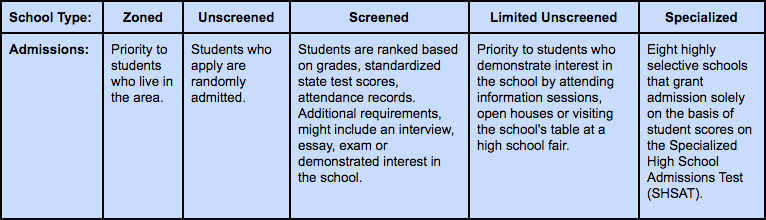
Complicating the process is a lack of uniformity in admissions across schools, detailed the table below:
This year, 76,000 students applied for admission to New York’s public high schools. Nearly half of them received an offer from their first choice school. Only 7 percent of students were not matched in round one.
The Schools
One of the biggest hurdles is the Specialized High School Admissions Test (SHSAT) for the city’s eight elite high schools, which was designed to level the playing field by standardizing the admissions process with a single score. Instead, the test actually creates racially imbalanced school populations because low-income communities have limited access to high quality schools and test prep programs that help boost scores. We talked to some students who didn’t know how important the test was, and sat for it without any preparation. Close to 30,000 students took the Specialized High School Admissions Test last fall; roughly 5,000 were offered seats based on their exam score.
Almost all of our profile subjects applied for one the “Big 8,” including Brooklyn Technical High School and Stuyvesant High School.
Family involvement can affect a student’s process in different ways. For some children, parental oversight was not helpful, and compelled students to apply for schools that were not a good fit. In other cases, parent and child alike didn’t have good information about the application process, armed only with the phone-book sized Directory of High Schools to help them navigate the available options.
And the process doesn’t end after eighth grade. If students are unhappy with their assigned school, they can apply to transfer the following year, but the odds don’t look great. In 2014, for example, 57 percent of the 4,425 students applying to 10th grade were matched with their choices, compared to 90 percent of students applying to ninth grade who were matched.
The Map
Each point on the map below represents a featured student’s middle school. Click on a marker to learn more about a student. Clicking on the picture will take you to a full profile on the student.