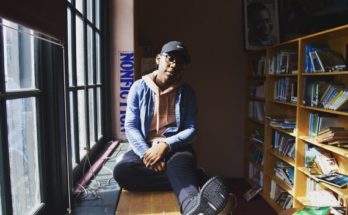
Michelle Mataraso has three children who attend P.S. 6 Lillie D. Blake, a traditional elementary school on the Upper East Side of Manhattan. Every day, they “bring something home to put on the fridge,” Mataraso, a homemaker who used to be a teacher, said. Felix Jimenez’s son is a third-grader at P.S. 178 Saint Clair McKelway, an elementary- and middle school in Brownsville, Brooklyn. He said the one time his son brought something from school to show, it was bite marks he got in a fight. “He hates going to school,” said Jimenez, an electrician, about his eight-year-old.
New York is a city of contrasts. It has the largest income gap of any city in the United State, according to U.S. Census Data from 2005 to 2009. The richest 10 percent in the city are 13.5 times richer than the poorest 10 percent of the population.
One reflection of the city’s haves and have nots is the vast difference between its 1,700 public schools, the learning environment they provide, and the neighborhoods they inhabit.
School District 2, where P.S. 6 is located, includes neighborhoods like the Upper East Side and Chelsea. School District 23, where P.S. 178 is located, encompasses Ocean Hill and Brownsville. Child poverty is lowest in the Upper East Side at 2 percent; it is highest in Brownsville at 53 percent.
The map below shows 40 elementary- and middle schools in Manhattan and 23 in Brooklyn. Schools in Brownsville have higher poverty rates on average than schools in District 2 in Manhattan, and lower grades, too.
School Poverty Clusters in Brownsville and Lower Manhattan.
Graphic created based on data from the Department of Education progress reports.
School poverty rate in percent, based on DOE data:
LOW: 5 to 28.5
HIGH: 52 to 75.5
VERY HIGH: 75.5 to 99
School poverty is measured by the number of children who qualify for free or reduced lunch. The rate is 82.3 percent for Brownsville’s 23 elementary and middle schools. Seven of its district schools received an “A” on the most recent Department of Education report cards, while three received “F’s.” P.S. 178 ranks at the top of the poverty scale with 86 percent of its 575 children qualifying for free lunch. The school is 83 percent black, with 15 percent Hispanic. Last year, it received a “C” from the city’s report card.
Jimenez believes the low scores reflect a poverty of resources and after-school programs provided by the city. He said he does not feel comfortable dropping his son off at P.S. 178 in the morning. “There’s no teacher, no kind of supervision in the schoolyard,” Jimenez said. Nor, he added, are there after school enrichment opportunities for the children.
Not surprisingly, schools in District 2 have much lower poverty rates and much higher grades: the average poverty rate in the district’s 40 schools is about 38 percent; 20 schools received an “A,” while only one received an “F.”
The report cards are an imperfect measure of individual learning, but in the aggregate they provide a picture of inequity. Eighty-five percent of the report card score is based on math and reading standardized scores; 60 percent of which measure growth in scores from one year to the next. The other 15 percent reflects parents’ and students’ survey responses to the school’s environment.
At P.S. 6 on the East Side, the poverty rate for its 789 children is 5 percent. Its racial makeup is the mirror opposite of P.S. 178; it is 72 percent white, 10 percent Hispanic, and 3 percent black. Its school report grade was an “A” last year.
“My kids love it, it makes them very happy,” Mataraso said.
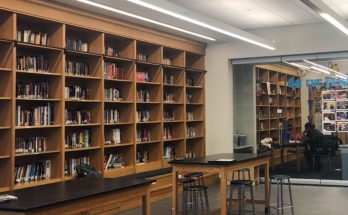
Students are taught an instrument by outside musicians or participate in a ballroom dancing classes. These programs are funded by the parents in the school. Mataraso also praised the after-school chess club, the school’s “very big” library and the “warm and loving” staff. “There’s nothing I would change about the school.”